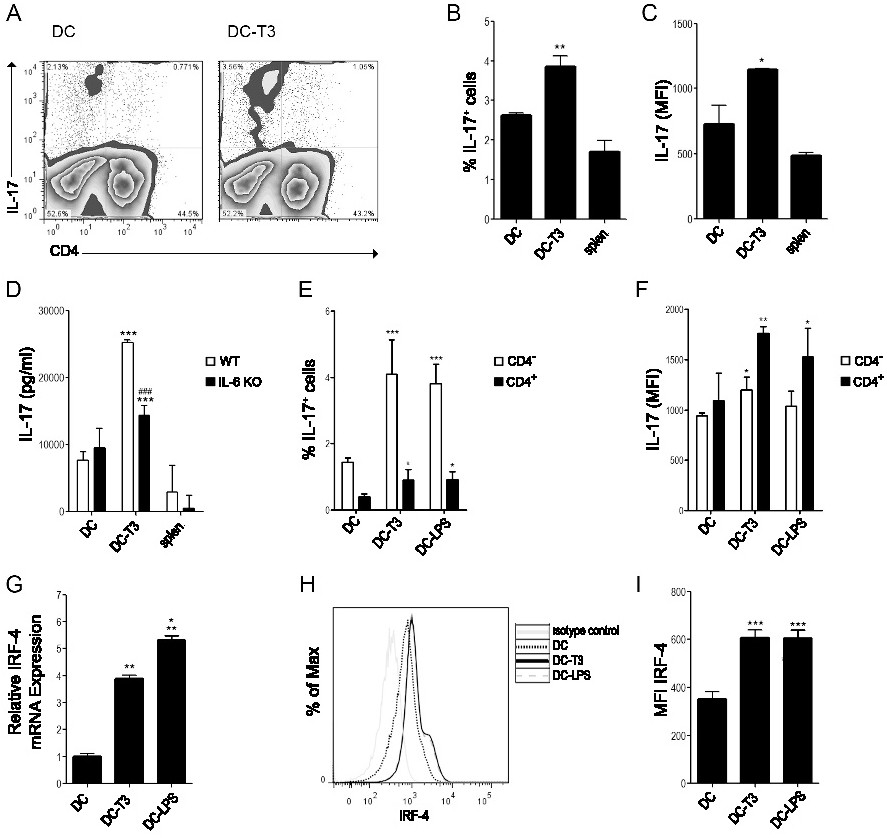
Fig. 2. T3-stimulated DCs induce IL-17 production. DCs obtained from wild type (WT) or IL-6 knockout (KO) mice were stimulated with T3 (5 nM, DC-T3) or LPS (100 ng/ml, DC-LPS) for 18 h or left untreated (DC). Then, DCs were cultured for 3 days with allogenic splenocytes (splen.). Intracellular IL-17 production was measured by flow cytometry (A, B, C, E, F) and in culture supernatants by ELISA (D). Values in representative density plots show the percentage of activated CD4+ and CD4- T cells producing IL-17 (A). Comparative analysis of the frequency (B) and mean fluorescence intensity (MFI, C) of total IL-17 expressing cells. Determination of IL-17 secretion in culture supernatants from allogenic cultures with WT or IL-6 KO DCs (D). Comparative analysis of the frequency (E) and MFI (F) of CD4+ and CD4- IL-17 expressing cells. IRF-4 mRNA levels measured by RT-qPCR (G) and IRF-4 intracellular protein by flow cytometry: expressing cells (H, I). Results are expressed as mean ± SD of a representative experiment of 3 with similar results performed in triplicate. *p<0.05, **p<0.01, ***p<0.001 vs. DC; ***p<0.001 vs. DC WT or KO, respectively; ###p<0.001 vs. DC-T3 WT.